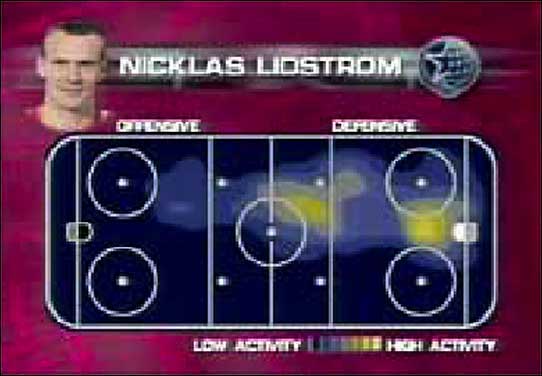
This was an actual working visual graphic of the time a hockey player spent on the hockey rink.
Data was fed into the system and when the hockey player stayed int he same place for a long time
the graphic would turn yellow in that spot.
This was an actual working visual graphic of the time a hockey player spent on the hockey rink. Data was fed into the system and when the hockey player stayed int he same place for a long time the graphic would turn yellow in that spot. |
|||||
| © copyright 2001 Trakus Inc. | |||||
| Back | |||||